- Author Isaiah Gimson gimson@periodicalfinance.com.
- Public 2023-12-17 02:53.
- Last modified 2025-01-24 12:06.
To compare two samples taken from the same population, or two different states of the same population, the Student's method is used. With its help, you can calculate the reliability of differences, that is, you can find out if the measurements you can trust can be trusted.

Instructions
Step 1
In order to choose the correct formula for calculating the reliability, determine the size of the sample groups. If the number of measurements is more than 30, this group will be considered large. Thus, three options are possible: both groups are small, both groups are large, one group is small, the other is large.
Step 2
In addition, you will need to know if the dimensions of the first group are dependent on the dimensions of the second. If each i-th variant of the first group is opposed to the i-th variant of the second group, then they are called pairwise dependent. If variants within a group can be interchanged, such groups are called groups with pairwise independent variants.
Step 3
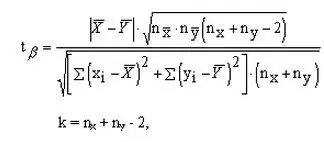
To compare groups with pairwise independent variants (at least one of them must be large), use the formula shown in the figure. With the help of the formula, you can find the Student's criterion, it is according to it that the confidence probability of the difference between the two groups is determined.

Step 4
To determine the Student's t test for small groups with pairwise independent options, use another formula, it is shown in the second figure. The number of degrees of freedom is calculated in the same way as in the first case: add the volumes of the two samples and subtract the number 2.

Step 5
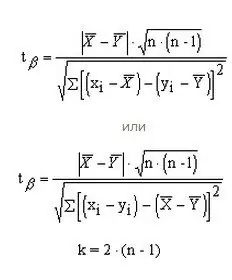
You can compare two small groups with pairwise dependent results using two formulas of your choice. In this case, the number of degrees of freedom is calculated differently, according to the formula k = 2 * (n-1).

Step 6
Next, determine the confidence level using the Student's t-test table. At the same time, keep in mind that for the sample to be reliable, the confidence level must be at least 95%. That is, find in the first column your value of the number of degrees of freedom, and in the first row - the calculated Student's criterion and estimate whether the obtained probability is less than or greater than 95%.
Step 7
For example, you got t = 2, 3; k = 73. Using the table, determine the confidence level, it is more than 95%, therefore, the differences in the samples are significant. Another example: t = 1, 4; k = 70. According to the table, in order to obtain the minimum confidence value of 95%, for k = 70, t must be at least 1.98. You have less - only 1, 4, so the difference in the samples is not significant.


